For this post, I have brought together a few sources to produce a basic map of the World War II Allied Strategic Bombing campaign in Germany below. This map uses a modern-day map of Germany, though the locations of these cities have not changed. The data for this map comes from the United States Strategic…
Author: admin
Project #4: Did Allied Strategic Bombing become more effective over time?
As mentioned in a previous post, the use of new technology such as White Phosphorus likely did increase the damage dealt by fire raids in later years of the war. Could we see a clear improvement in effectiveness over time with total damage as well? For this post, I am comparing two specific HE and…
Workshop 12: Working with Maps
This is a map of my college town Dahlonega, Georgia in the United States. I have spent many years studying here and it is a very important place to me. While this is not directly related to my projects on this site, this is a learning experience for a future map of Germany I will…
Workshop #11: Visualization Plan
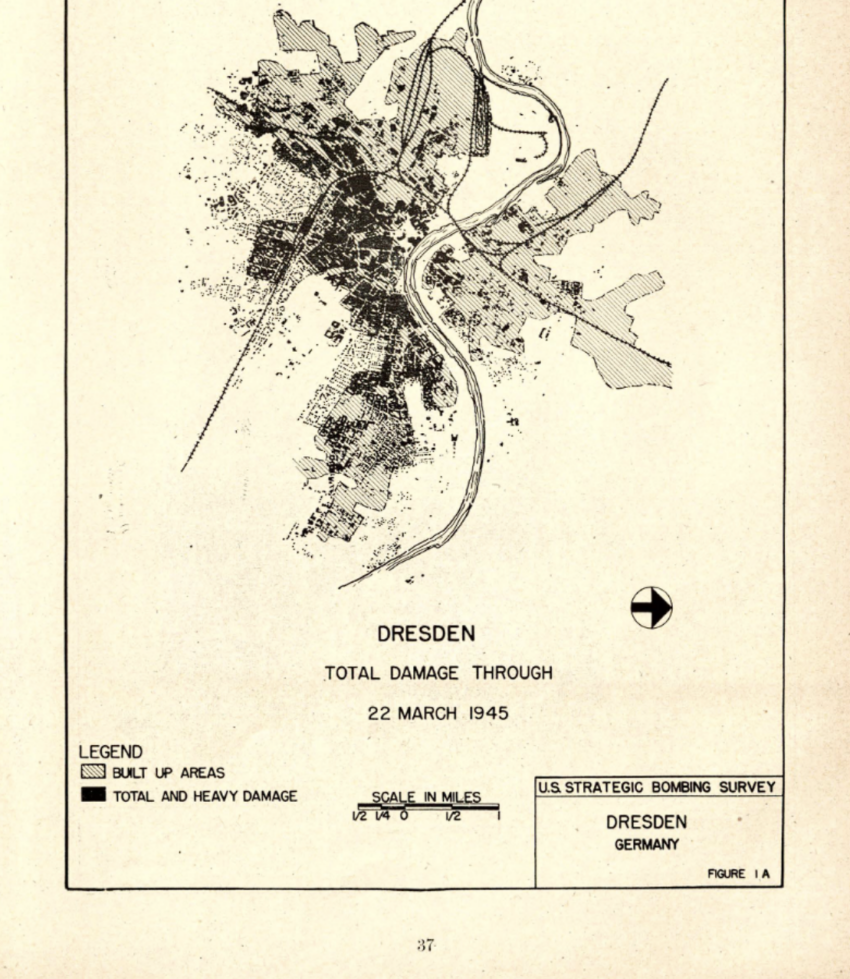
Over the course of my research, my focus has shifted from the damage to Dresden, urban loss, and its post war recovery to more of a study of allied strategic bombing on Dresden. I have not forgotten my original question, however, and while it likely take coding skills that I do not have to do,…
Digital Project #3: Visualizing Data on Dresden’s Destruction
As shown in my prior post, comparing the amount of bombs dropped on Dresden to other cities leads to some interesting and unexpected conclusions. See the chart below. This chart shows that Dresden was hit mostly by high explosive (HE) bombs, and all three cities that I have collected data on were attacked with a…
Dresden’s bombing Compared
For this post, I am again stating that the people who died in Dresden, Hamburg, Leipzig, and in any city hit by strategic bombing on all sides of the war, were people. Reducing their experiences to statistics is not the purpose of this or any project I will publish on this site. We must remember…
Datawrapper Test Workshop
Workshop 9: Visualization Practice
This is a workshop for visualizing data using a dataset of Chicago Homicides from the late 19th and early 20th Centuries. We are specifically using data pertaining to alcohol-related deaths. This chart shows alcohol-related deaths that occurred near or around a vehicle per year. There is a noticeable spike in these deaths as we move…
Chicago Homicide Workshop
Graph of Alcohol-related homicides by Year
Sourcing Data on the Bombings
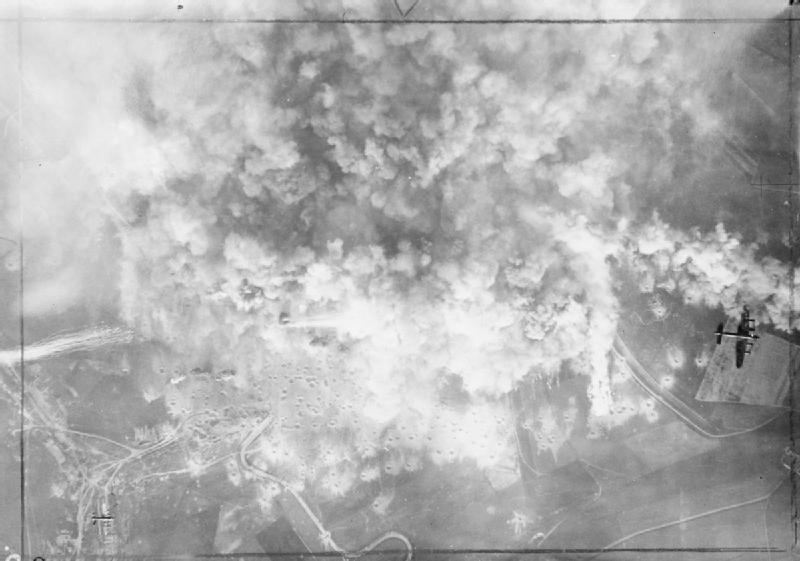
A quick note before I write about statistics; these were people, not numbers. As I write about strategic bombing, percentages of destroyed cities, population loss, and other statistics, we, as in historians and the reader, cannot forget that these statistics represent people, their deaths, terror, and lived experience. To fully understand the damage dealt to…